India’s poverty story since the early 1970s is one of steady—though uneven—decline, shaped by changing methods of measurement, structural reforms, and targeted welfare programmes. Using official estimates and reputable international updates, we can trace how the headcount ratio (share of people below the poverty line) moved across five decades.
1973–1993: A long, steady fall under the Lakdawala method
The earliest consistent, all-India series comes from the Planning Commission’s “Lakdawala” methodology. It shows the national poverty ratio easing from about 55% in 1973–74 to roughly 36% by 1993–94. Rural poverty fell from 56.4% to 37.3% and urban poverty from 49% to 32.4% across the same period. The headcount came down, but the absolute number of poor hovered near 320 million for much of this time due to population growth.
This reduction was supported by the Green Revolution’s impact on food security, moderate growth, and early anti-poverty schemes. However, poverty remained high, especially in rural regions, and inter-state gaps were large.
2004–2011: Faster decline under the Tendulkar method
In 2009, India adopted the “Tendulkar” methodology, which re-anchored poverty lines and allowed better comparison across states. On this yardstick, the all-India headcount fell from 37.2% in 2004–05 to 21.9% in 2011–12—an unusually rapid pace of about 2.18 percentage points per year, much faster than the 0.74 percentage-points average in 1993–94 to 2004–05. In absolute terms, people below the poverty line declined from ~407 million to ~270 million.
The quick drop reflected broad-based growth in the 2000s, rising real wages in parts of rural India, expansion of rural roads and electrification, MGNREGA’s income effects, and improvements in public delivery systems.
Post-2011: Continued progress, but measures differ
After 2011–12, India did not release official Tendulkar-based poverty for want of a regular consumer expenditure series until 2022–23. Researchers and international bodies filled the gap with model-based updates. The World Bank’s overview notes India “halved” extreme poverty between 2011 and 2019 (at the global $2.15, 2017-PPP line), with a pandemic-era slowdown and a rebound by 2021–22. These are international lines and are not directly comparable to India’s domestic poverty lines, but they still signal continued progress.
With the release of 2022–23 household consumption data, newer analysis suggests substantial declines by broader international thresholds as well. For example, a Government press note summarising World Bank analysis reports poverty at the $3.65/day line fell from 61.8% in 2011–12 to 28.1% in 2022–23, implying large rural and urban gains. Again, this is an international poverty line and should not be mixed with Lakdawala or Tendulkar figures.
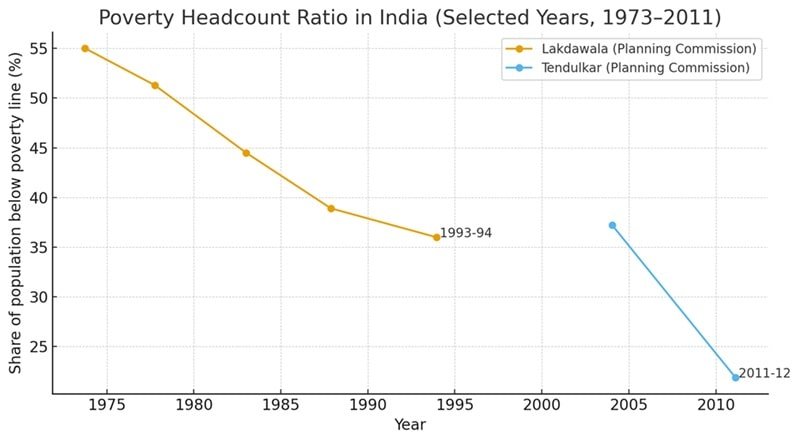
The chart attached plots selected years from the two main official Indian series—Lakdawala (1973–74 to 1993–94) and Tendulkar (2004–05, 2011–12). You’ll notice a break between 1993–94 and 2004–05 and a sharp drop thereafter. That break is intentional: methods changed, and values are not directly comparable across the break. Use each segment to see the direction within its method; use narrative and multiple sources for the big picture.
What explains the decline?
- Agricultural and structural change: Higher farm output, diversification, and a gradual shift toward non-farm jobs raised incomes over time.
- High-growth 2000s: Rapid GDP growth translated into faster poverty reduction, especially 2004–2011.
- Welfare and inclusion: Expansion of safety nets (PDS reforms, MGNREGA, rural infrastructure, DBT, LPG, sanitation, electrification) improved living standards and resilience, especially in rural areas. (Inference from official reductions and programme timelines.)
- Recent decade: International evidence points to continued reductions through 2019, a pandemic shock, and recovery by 2021–22; 2022–23 data now enable more formal updates.
Bottom line
From ~55% (1973–74) to ~36% (1993–94) on the older method, then 37.2% (2004–05) to 21.9% (2011–12) on the Tendulkar method, India has seen a clear long-run fall in poverty. International lines suggest the decline continued into the late 2010s and early 2020s, though those measures are not strictly comparable to domestic lines. Read trends within each series, and treat cross-series jumps with caution.